Transition to OpenSearch
Rocco Gagliardi

This is how you Log Timeseries in Databases
In recent years, moreover, we have gone from a mostly static network to extremely dynamic networks, with micro-services that constantly change both in number and in position. Keeping track of these changes, for debugging or for Business Analysis or Intelligence (BA/BI), has become very complex and expensive, as the heavy-index solution does not scale easily and requires high investments.
The problem of keeping track of events happening in applications in a human-readable form is destined to disappear in the near future. In addition to being often useless, the amount of data generated is becoming unmanageable. Solutions in which machines communicate problems to machines that make the necessary adjustments, cutting human intervention completely, are already in use and their number is increasing. In the meantime, however, the problem exists and needs new solutions.
Without taking anything away from the BA/BI solutions currently in use, the key, especially for the Operation department, lies in the concept of observability: Determining the functioning of a system by analyzing its outputs, basically metrics, logs, and traces.
In recent years, Grafana has been elected to defacto standard for observability, with some specialized tools for each pillar:
As mentioned before, microservice systems produce a huge amount of data. To manage them, we are increasingly moving towards systems with light indexing, as opposed to the trending systems that make massive use of indexing.
Loki is a horizontally-scalable, highly-available, multi-tenant log aggregation system inspired by Prometheus. It is designed to be very cost-effective and easy to operate. It does not index the contents of the logs, but rather a set of labels for each log stream.
Is Loki a replacement for ELK, Splunk, or Graylog? No. It is up to you to use Loki, ELK or a combination of both. Some differences between the two system classes are shown in the table.
| Capability | Heavy Index | Light Index |
|---|---|---|
| Write Performance | low | high |
| Read Performance | high | high |
| Typical index size (compared to data) | >50% | <5% |
| Filter capabilities | high | low |
| Aggregation capabilities | high | low |
| Scalability | low | high |
| Cost | high | low |
Take as example the Apache httpd log: ELK will split a typical httpd logline in ca. 12 pieces and index each of them. Loki will index just 3 pieces: Timestamp, Method, HTTPStatus.
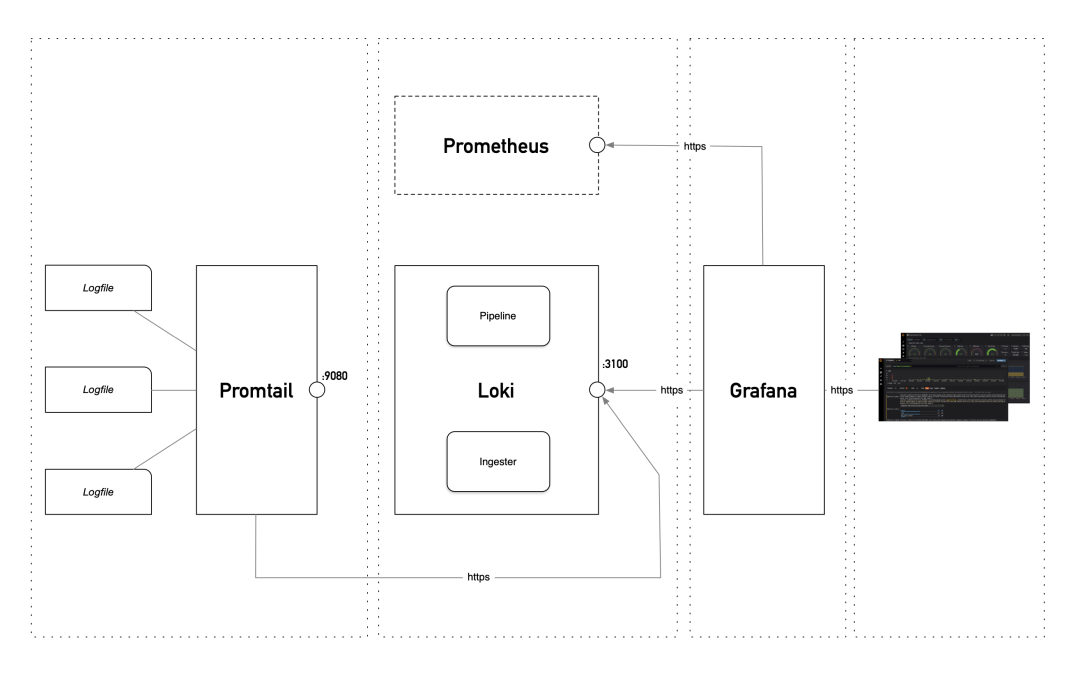
Getting logs with Loki involves two simple components: The Loki server and the Promtail client. Both are written in Go, therefore are extremely easy to deploy as just a single file. As Grafana, Loki is based on Cortex Database that is scalable and multi-tenant.

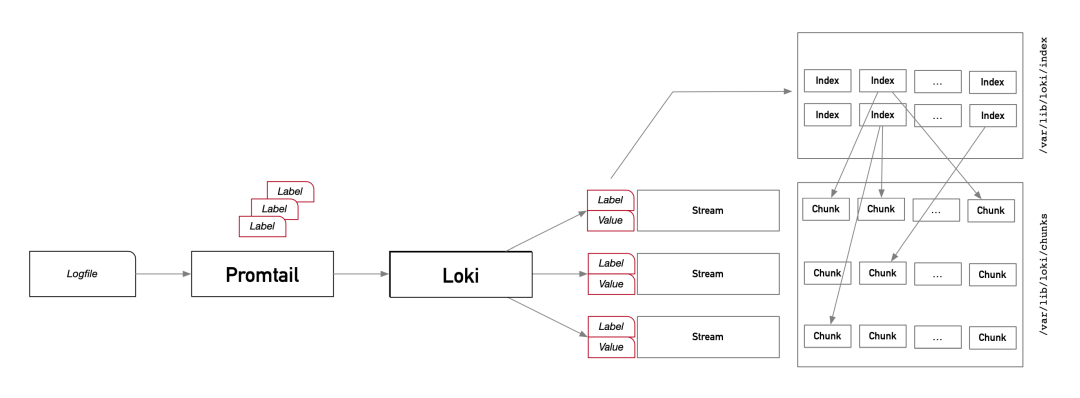
Loki does not index data, it indexes and groups log streams. It divides data in chunks, fed by streams, and stores them on the file system (we used a similar technique for our specialized search engine).
Streams are identified by Labels. Labels are k->v pairs, that can be extracted from any part of the data. Every unique combination of labels and values defines a stream, and logs for a stream are batched up, compressed, and stored as chunks. Each chunk is compressed using a configurable algorithm (default gzip).
So, chunks are the index to Loki log data. They are used to find the compressed log content, which is stored separately. Once the right chunk is identified in the index, the chunk is decompressed and content grepped with regexp. It’s may sound weak, but since concurrency can be leveraged, the searches are really fast.

Note: The index size, or the access speed, depends on the number of chunks. The number of chunks depends on the number of streams which depends on the number of combinations of labels and values. It is therefore clear that, unlike an ELK, although it is possible, it is not recommended to index (label) for example IP Addresses, since each new IP would create a new stream. This means, for example, that searches on a specific IP and over a long period of time do not perform well in Loki.
To obtain excellent search times, it is, therefore, necessary to carefully choose the labels to extract and use.
Loki’s use-case is specific: To support the debugging process by quickly filtering important messages from the amount of those generated by the different systems involved in an application. A container environment is an ideal playground for Loki.
The power of Loki is shown if it is integrated with Prometheus; using the same labels it is possible to refer to the same segments of data and compare the metrics with the messages of the various systems.
The creation of dashboards, trends, counts etc. is not Loki’s strong point. Think of Loki as a power-grep.
Every system creates logs: Switches, routers, OS, Web servers, firewalls, services on your Kubernetes clusters, public cloud services, and more. Especially for operators, being able to collect and analyze these logs is crucial. And the growing popularity of microservices, IoT, cybersecurity, and cloud has brought an explosion of new types of log data.
Loki tries a different approach from heavy-index systems like ELK. By avoiding extreme indexing and renouncing to the possibility of aggregating and finely filtering the collected data, it focuses on extremely fast ingestion of large masses of data and equally fast search for portions of them, maintaining multi-tenancy and scaling at very low costs.
Our experts will get in contact with you!

Rocco Gagliardi

Rocco Gagliardi

Rocco Gagliardi

Rocco Gagliardi
Our experts will get in contact with you!