Security Testing
Tomaso Vasella

How to Analyze Network Traffic with Windows
The question is whether, in analogy to the well-known tools such as tcpdump or Wireshark, pktmon can now be used on a Windows system to make rapid analyses of possible indicators of a compromise.
The analysis with tcpdump on Linux with some Bash commands for sorting and filtering packet captures is relatively powerful and easy to do. Therefore, the question arises whether this is possible with pktmon under Windows with built-in mechanisms.
In the following article we will introduce first steps with pktmon and look for ways to get quick analysis results from the captures in a security context. For this purpose, a small lab environment with a current Windows 10 Pro as a test client and a Kali Linux as an additional participant in the network was set up.
The packet sniffer pktmon can be found at C:\Windows\System32\pktmon.exe, but can be executed anywhere on the command line with pktmon.
It is recommended to create a directory where the first captures are stored, because C:\Windwos\System32\ is not the ideal place for this. The directory C:\tmp\pktmon was created for this purpose.
To get an overview of the options of pktmon, help can be appended after each command. Furthermore, pktmon must be executed as Administrator in order to use it effectively.
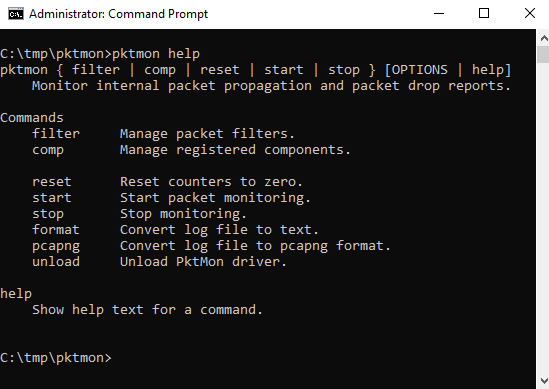
Most available commands are self-explanatory (filter, start, stop, etc.). Except for comp it is not immediately obvious what is behind it. This can be clarified with help.
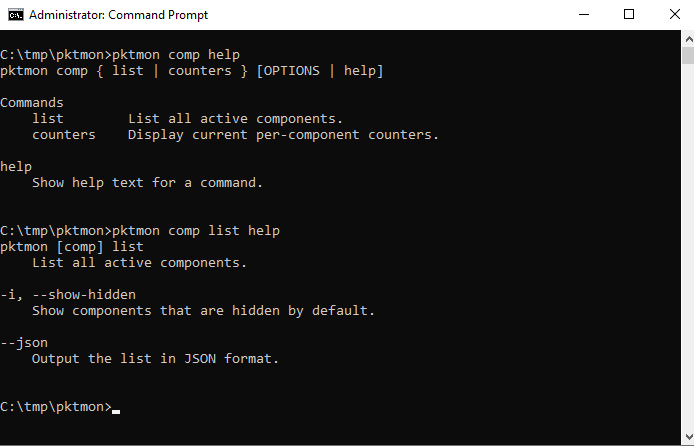
After the help menu, pktmon comp list can be used to display all active components.
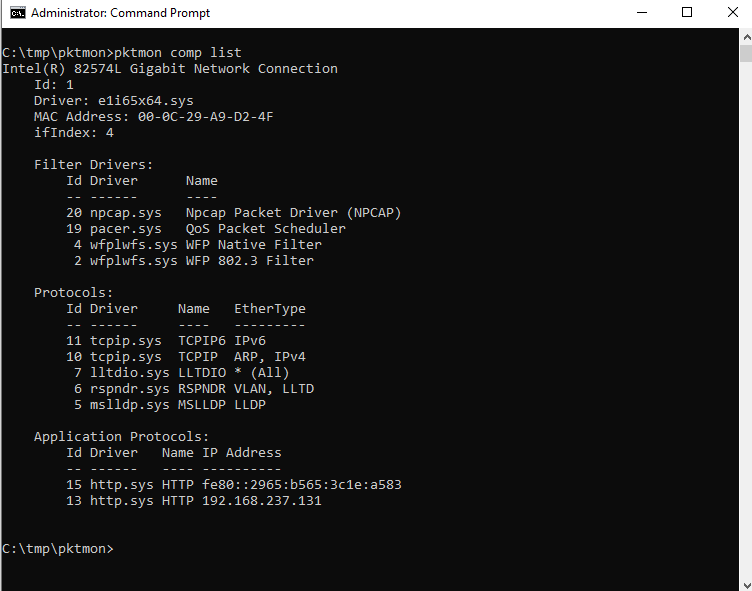
Now it can be seen that comp means, among other things, the network interfaces available for a capturing. In this test system there is only one active interface with the comp ID 1.
Since pktmon was not developed explicitly for security issues but for troubleshooting, the entire network stack is shown with their respective IDs. E.g. in virtualized environments with multiple network stacks (Host, Guest, VPN, VLANs etc.) this can be helpful for troubleshooting. On a production system the list of Components can be quite long, so it is important to be aware of which interfaces you want to capture traffic on.
The command filter also seems more relevant for troubleshooting if only specific ports, IPs, protocols etc. are to be captured. For a first analysis in a security context, a complete capturing is useful and only for an effective analysis sorting and filters are needed.
But now to the relevant settings for a first capturing. To do this, execute the command pktmon start with the appropriate options. Here, too, it is worth looking at the help menu.
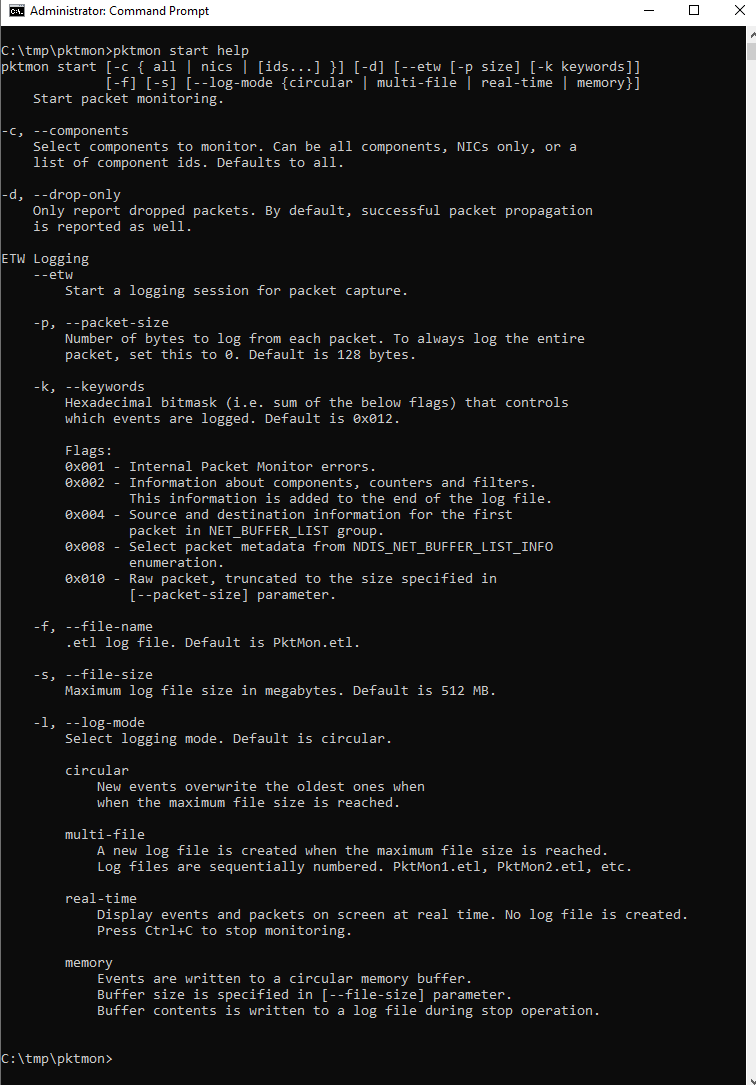
From the help information the following command can be composed, which should provide a useful capturing for further analysis:
pktmon start --etw -c 1 -p 0 -k 0x010 -l multi-file
This is the configuration in detail:
start: Starting pktmon--etw: Starting a logging session-c 1: On the interface with the ID 1 is to be captured-p 0: The entire packet is to be captured (by default only 128 bytes)-k 0x010: only raw packet should be saved, errors and statistics should be ignored-l multi-file: Default is the log file size 512MB and the circular-mode, which overwrites the old entries after 512MB of data. With multi-file, a new file is created after every 512MB of data.The duration of the capturing depends strongly on the circumstances. For the first attempts, which are presented here, only a few minutes of traffic were captured. With pktmon stop we stop the logging session.
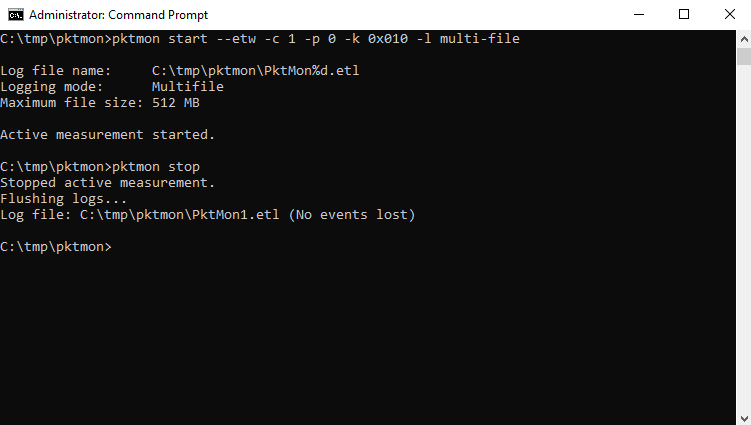
The output is a Windows trace log file in etl format. This can be opened e.g. with the Windows Event Viewer, or with the (no longer supported) Microsoft Message Analyzer. Furthermore pktmon offers the option to format the etl file as txt and since the version in Windows Update 2004 also in the common pcapng format.
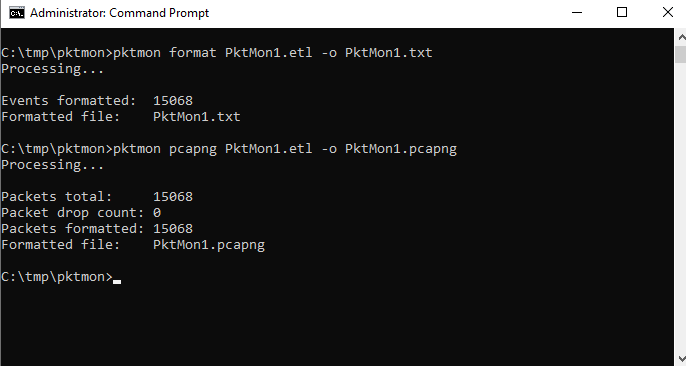
For a detailed analysis, tcpdump or Wireshark would be preferable, which is also possible without problems using the pcapng format.
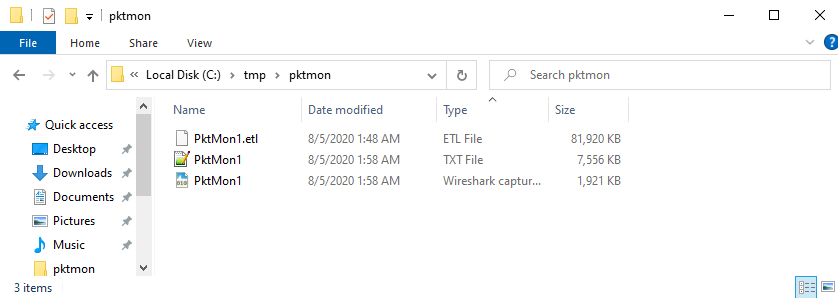
If, for various reasons, loading tools or exporting captures is not possible, the only choice is the Event Viewer or text-based export. When looking at the three files (.etl, .txt and .pcapng) it is also noticeable that they differ massively in size.
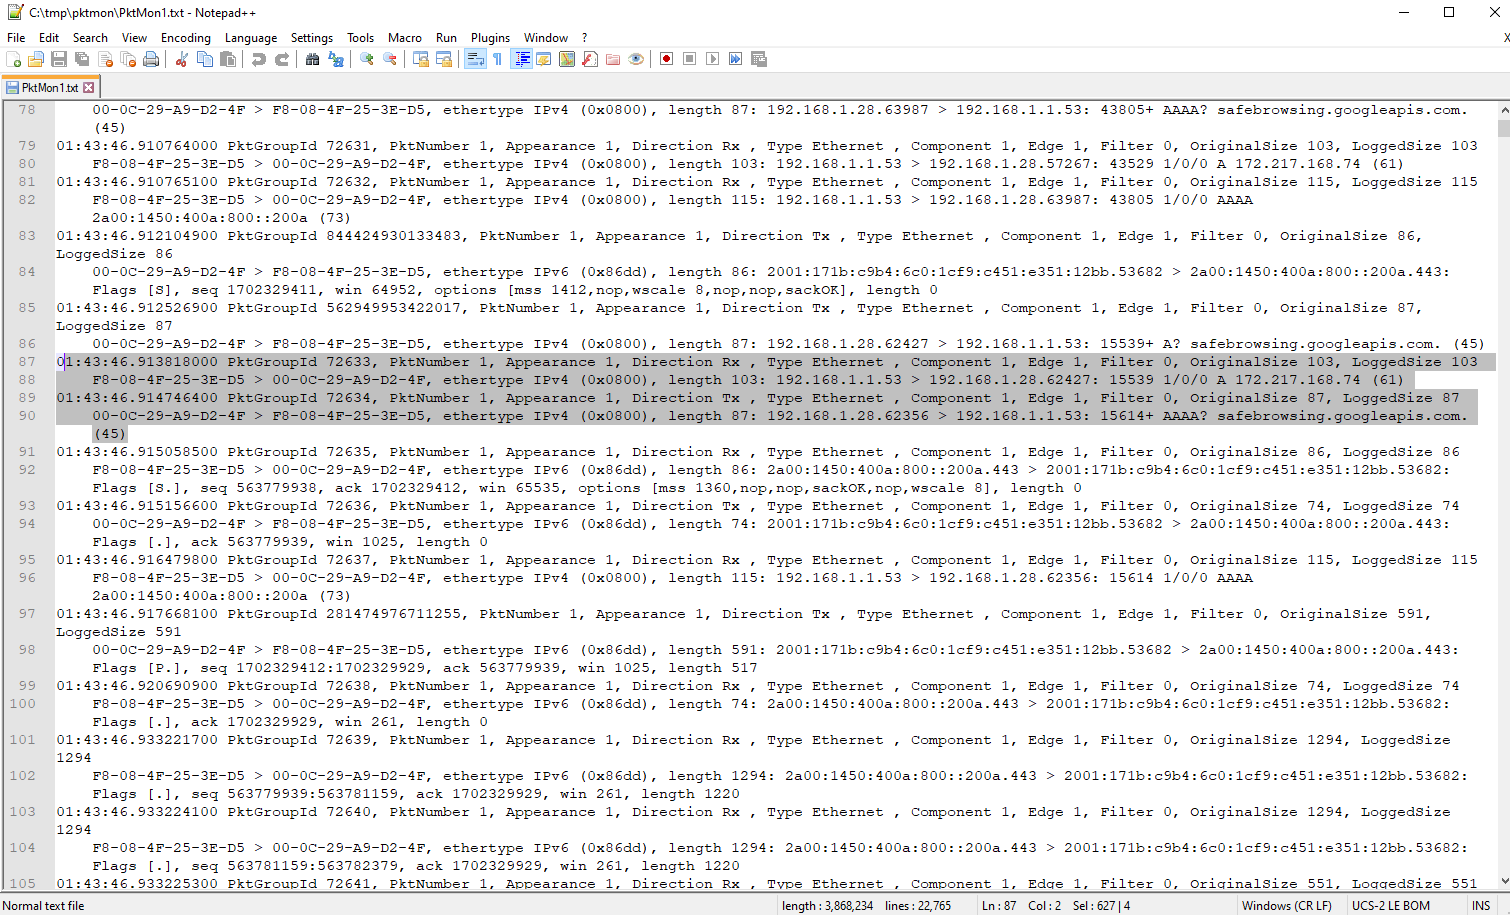
If you look at the text file in an editor, with the ulterior motive (e.g. as CSV in PowerShell) to be able to analyze this quickly, you can note the following:
Line Break and an TabMAC SRC and MAC DST as well as IP SRC and IP DST are separated with an >IP SRC and IP DST are also led and completed by :All in all, not necessarily a good starting point for a quick analysis based on a CSV. The missing payload in the text file can also take away a lot of informative context from the analysis.
Nevertheless, the comma-separated data might allow an analysis with PowerShell and its CmdLet Import-CSV. If this can be done with relatively little effort, quite a lot can be gained from the IP and port information.
With PowerShell Import-CSV files can be read with delimiter, and then filters and sorting can be applied to the corresponding columns.
The text file format of pktmon is not ideal for converting it to a CSV file, but with only three “replacement” commands, the output seems to be reasonably usable.
The following PowerShell command reads(Get-Content) the pktmon text file and replaces(-replace), the break-tab combo to combine meta and packet data on one line, : and < are also replaced by commas and finally the output is saved as a CSV file(Set-Content).
((((Get-Content -path .\PktMon1.txt -Raw) -replace "\r\n\t",",") -replace ":",",") -replace">",",") | Set-Content -Path .\Pktmon1.csv
As trade-off, the hours and minutes in the metadata and the “back” variable parts of the package are now also comma-separated. Especially the timestamp is essentially important for the analysis, because the chronological sequence of actions is very revealing (Cyber Kill Chain). Writing an effective parser for the problem is not the goal in this article, but would certainly be a worthwhile investment for analyses with this setup.
Import-CSV takes the first line of the input file as header information by default. This is not necessarily an advantage. Furthermore, meaningful headers are helpful for further analysis. Since the number of columns is manageable, header information was quickly inserted by hand into the CSV file.
h, min, sec, pktnr, appear, direction, type, Interface(comp), edge, filter, orgsize, loggedsize, src.mac, dst.mac, ethertype, length, src.ip.port, dst.ip.port, a, b, c, d, e
For the first fields, a meaningful header name could be taken from the data, for subsequent columns, which no longer contain unique data, they were simply filled with a-e.
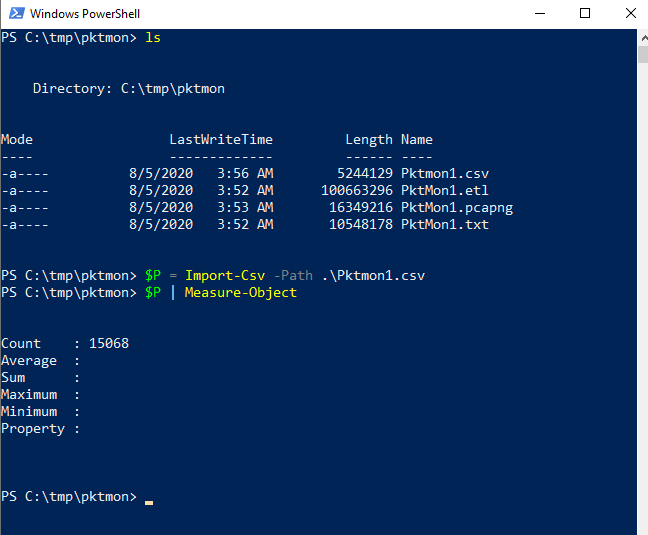
Next, the CSV file is loaded into a variable $P in PowerShell using Import-CSV, followed by a short check of the data using Measure-Object to see if all records are still present.
$P = Import-CSV -Path .\Pktmon1.csv

$P | Measure-Object
The counter shows 15068 records. This corresponds to the number in the command line output (see image pktmon format & pcapng) for the pktmon conversion to .txt and .pcapng.
Now the variable P can be queried using the many available PowerShell commands.
The query should have the following effect: Select the columns src.ip.port, dst.ip.port, direction and select those entries which contain Tx (packets sent by the test client) in the column Directions, then the whole thing should be returned sorted by the dst ports and only with unique entries. This should give you a first overview of the contacted remote ports and IPs.
$P | select src.ip.port, dst.ip.port, direction, min | where direction -like *Tx* | sort dst.ip.port -unique
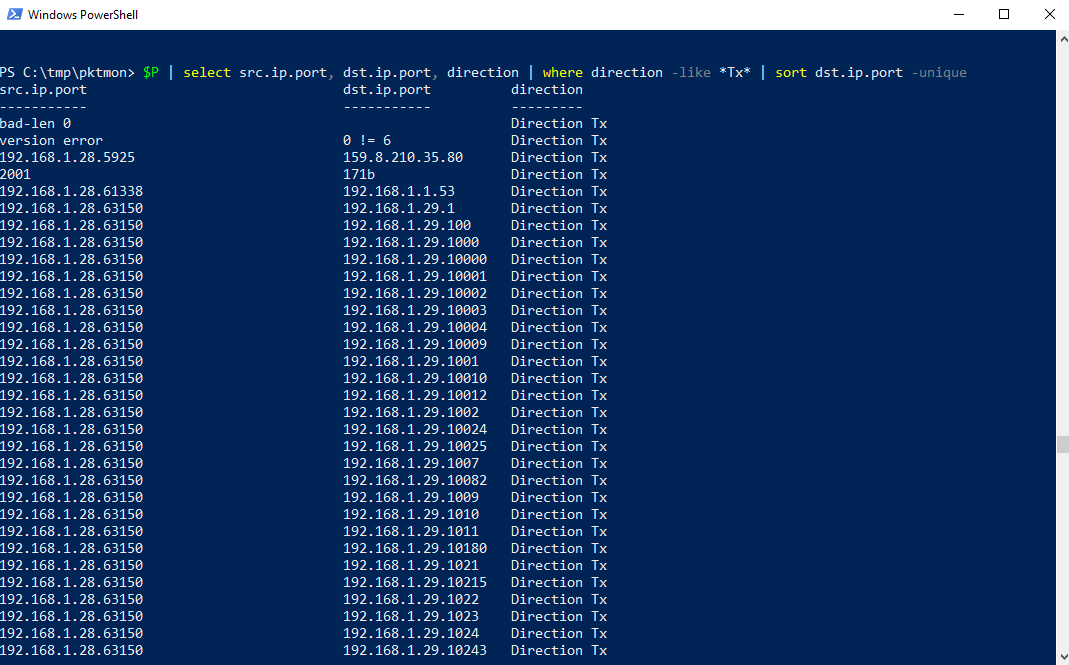
The following is noticeable: The test client communicates from the same port 63150 to many different ports on host 192.168.1.29, which indicates a port scan. The remote host is on the same subnet and therefore probably a client (client-to-client communication), which makes the scenario even more suspicious.
The port scan floods the view, so eliminating the source port on the test client might give a different picture. For this purpose, an additional where-filter is used to eliminate port 63150 on the SRC side.

Now you can see a bit better with whom the test client communicated, on port 80 and 443 (HTTP/HTTPS) to public IPs, port 53 (DNS) to the router and port 4444 to another client in the same subnet? This is again suspected, port 4444 appears unusual and is known at best for the default port of a Metasploit Meterpreter session. These filters seem to be a good way to detect rudimentary but revealing indicators of malicious actions.
Looking at the text export of pktmon, it is noticeable that the URL of a DNS request is barely available. This can only be used to extract further information from the capture.
The following query: Which packets were sent by the test client with the destination port 53 (DNS), and what packets were sent with the destination port 53 (DNS)? Additionally, the command format-table was added. Since PowerShell chooses a different format for the output above a certain width, which is not advantageous for the viewing, this command makes sure that the output is in a readable table.
$P | select src.ip.port, dst.ip.port, direction, a | ? direction -like *Tx* | ? dst.ip.port -like *.53 | format-table
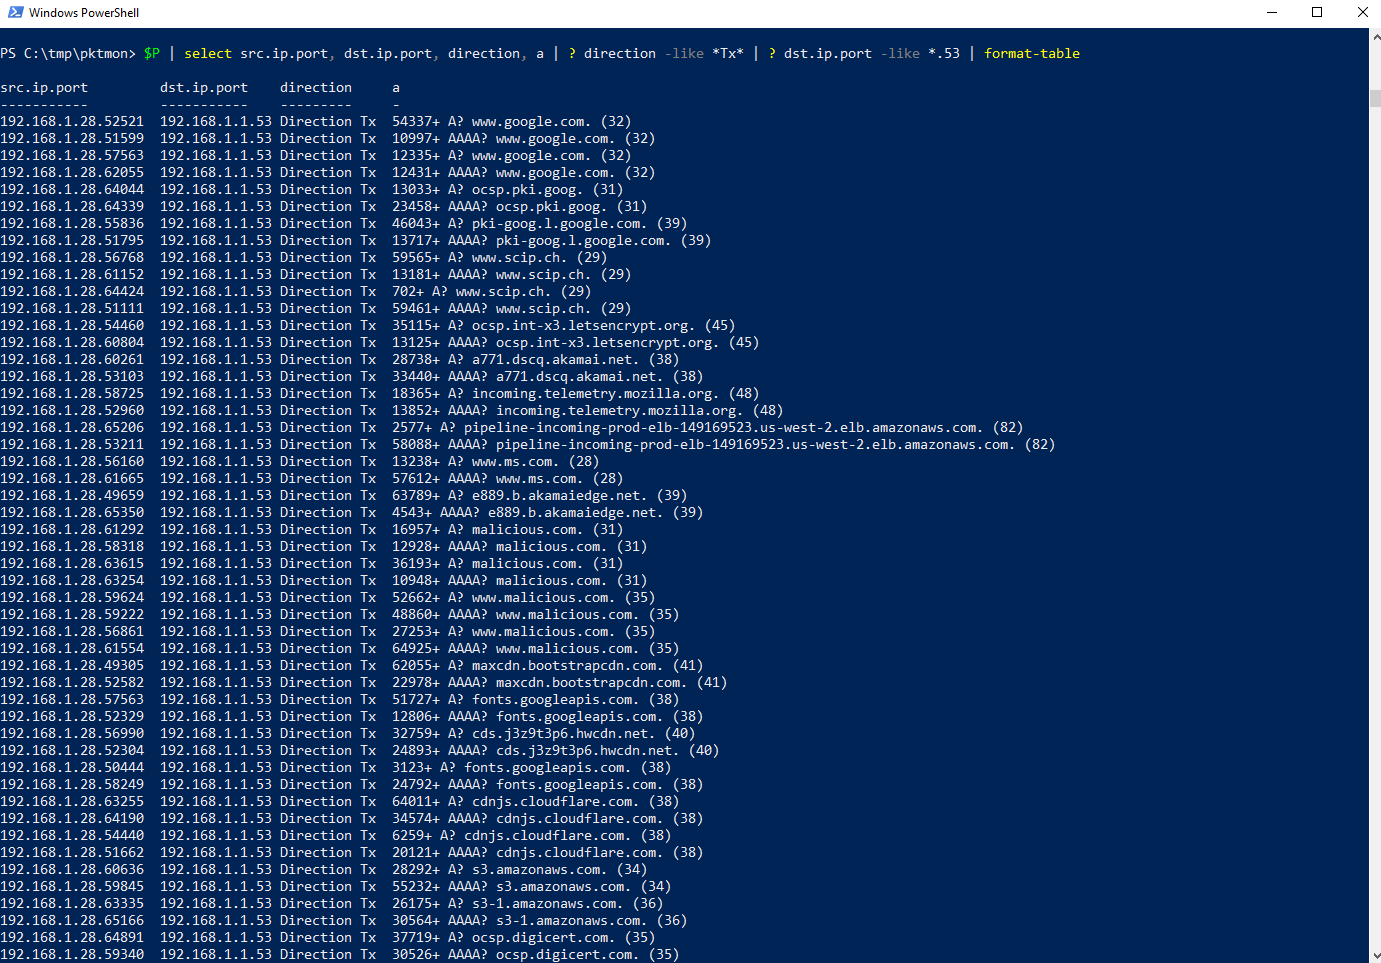
Looking at the result can give you an idea what happened on the client. At best, you can identify suspicious URLs and thus determine indicators for malicious actions.
With the help of the Windows tool pktmon and minimal PowerShell effort, a capturing of the data traffic can be created and analyzed relatively quickly. You can see that pktmon was designed more for performance troubleshooting. The analysis with PowerShell could probably be expanded considerably, but is not the goal for a quick analysis. Nevertheless, with Import-CSV and corresponding select, where, and sort statements a port scan, suspicious ports and URLs could be identified. These indicators are valuable in themselves and can form the basis for further and more in-depth analyses. However, the setup is not suitable for more extensive analyses, since, for example, a corresponding parser would have to be written for the formatting of the timestamps and the missing payloads in the text export.
Fortunately, Pktmon offers since the Windows 2004 update the export function as pcapng, which allows to analyze the captures in Wireshark or other tools. So, you can make recordings without any additional tools. Especially for security assessments on productive customer systems the installation of tools is not always possible. With pktmon the captures can be created, which can then be analysed offline.
Our experts will get in contact with you!

Tomaso Vasella

Eric Maurer

Marius Elmiger

Eric Maurer
Our experts will get in contact with you!