You want more?
Further articles available here

We have been monitoring the commercial market for exploits for years now, and this has allowed us to develop a model for calculating prices. This article analyzes current market structures and details some emerging trends. This allows us to identify what attackers want to achieve, as well as the robustness of various products.
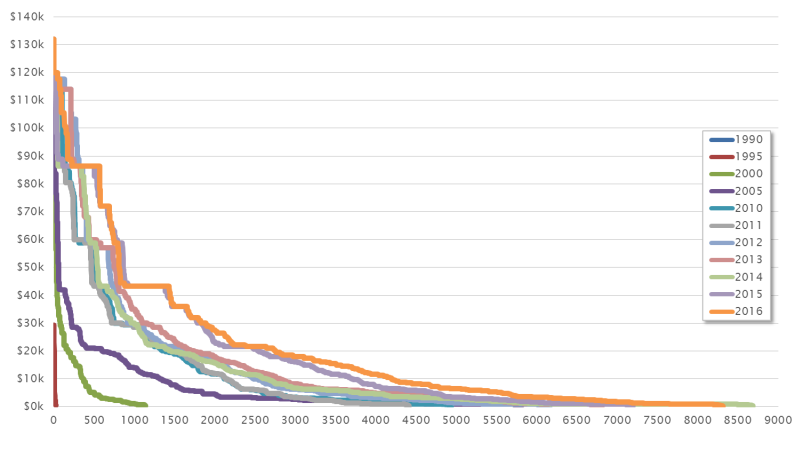
Our model makes it possible to establish both current and future prices. But by considering the historical context, it can just as easily determine prices for past exploits. The chart below illustrates the market structure in different years.
From this we can see that there was only a very small exploit market between 1990 and 1995. The number of vulnerabilities and their commercial potential was extremely limited.
It is only in 2000 that a curve emerges, and we can still see a rough outline of this today. However, this curve has gradually shifted: the number of vulnerabilities (x axis) and the prices for corresponding exploits (y axis) have experienced constant growth. We see various reasons for this:
We can assume that this trend will continue in coming years.
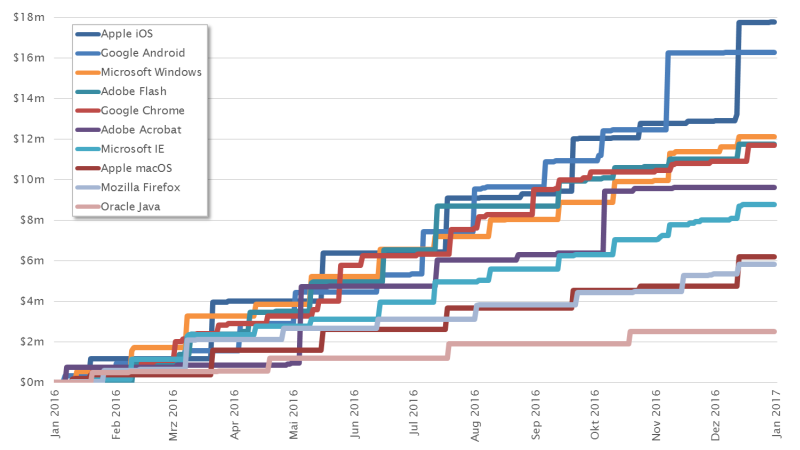
The chart below shows the price development of the exploit market for the 10 most popular products. Various things crystallize here with a fascinating consistency.
For years Apple iOS has distinguished itself as the leader of the pack. The price structure for the mobile platform is unique. But Google Android managed to catch up in 2016 with numerous expensive vulnerabilities. And it almost looked like there would become the new leading platform for the first time in November. This confirms the trend that we predicted, namely that Android would pull ahead of iOS at some point. But in December, Apple managed to defend its position once again.
Adobe Flash and Oracle Java are seen as browser technologies that are on the way out. Consequently, our price projections show a clear downward trajectory, because no one will be willing to spend more money on attacks on unpopular technologies in the long term. But until these technologies are completely replaced, they will be of continuing interest to the exploit market. People will continue to pay good prices for reliable exploits.
There are three web browsers among the top ten: Google Chrome, Microsoft Internet Explorer and Mozilla Firefox. This also confirms a trend that has been apparent for years: because of their simplicity and the popularity of browsers, web technologies are experiencing constant growth. This and the increasing complexity of web technologies have made them particularly interesting to the exploit market. For a few years now, very high prices have been paid for browser exploits. This could change markedly in the next five years.
Another conspicuous factor is that most curves exhibit a step formation. This can be attributed to the fact that many manufacturers use cyclical patch days, resulting in a clustering of published vulnerabilities. In 2003, Microsoft became one of the first big companies to announce this concept. Its monthly approach was adapted by a number of other software makers. Oracle, for instance, opted for a quarterly patch day, which is clearly reflected in the curve for Java.
The calculation model allows for a comparison of various manufacturers, product categories and product versions. This not only allows us to identify trends in relation to attacks, but also to understand what is driving software development. The following section discusses various scenarios and their impact.
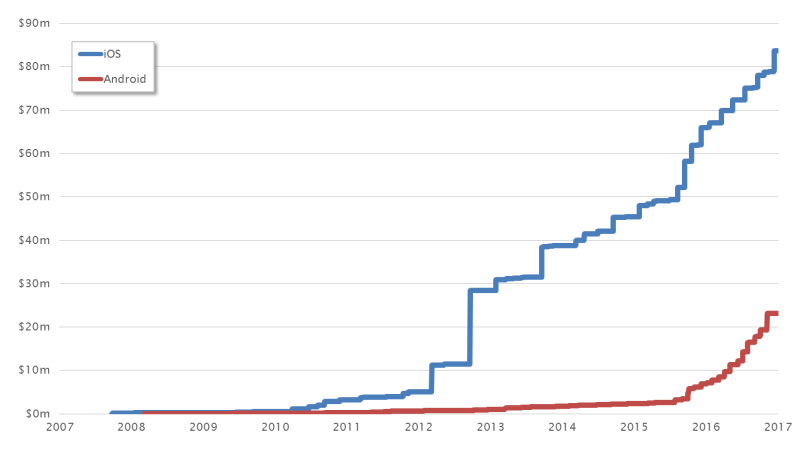
A comparison of the mobile platforms Apple iOS and Google Android shows how Apple has fought for its position at the top over the years. We can see this from the fact that the highest prices were paid for iOS exploits. In November 2015, prices for iOS exploits broke through the USD 1 million barrier for the first time. Since then, projections have been hovering around USD 1.3 million. We expect to see the USD 2 million barrier shattered in 2018/2019 at the latest.
At the same time, however, it is clear that Android is catching up. The large numbers of vulnerabilities found and their sometimes high degree of severity (see Stagefright) reduced Apple’s lead.
This chart completely ignores alternative platforms such as Windows Phone and Blackberry. Their respective exploit markets are too small to be considered in this context. However, the history of Nokia shows that things can change very quickly in the market for mobile telephones. Therefore, we are keeping our eye on the entire market for mobile platforms.
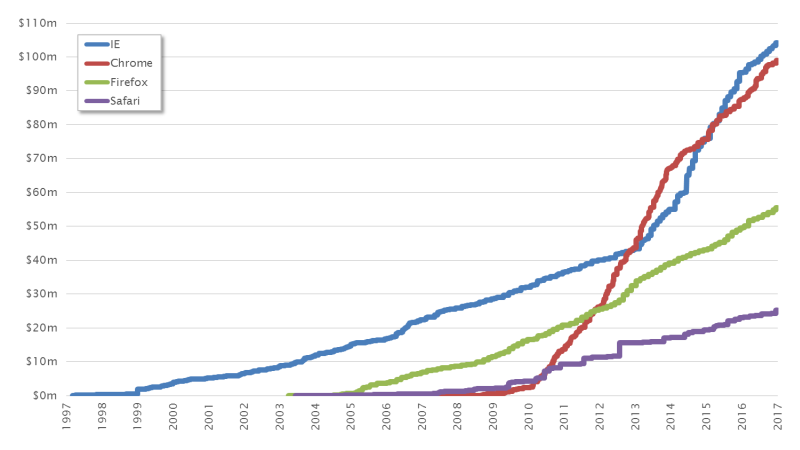
Web technologies have contributed significantly to the success of the Internet. Their simplicity means that these days practically no one can avoid using a web browser. At the same time, there has been constant development of new web technologies (e.g. XHTML, CSS, Ajax), which has increased the complexity of modern web browsers. As a result, this software category became particularly interesting to attackers.
What is fascinating about this chart is that the blue curve for Microsoft Internet Explorer and the red curve for Google Chrome intersect twice. This can also be traced back to various phenomena:
However, the sustained development of the curves shows once again that the popularity of a product determines how the exploit market is structured to a large extent. If a majority of users were suddenly to switch to the Opera browser, it would probably reach the top of the list within two or three years.
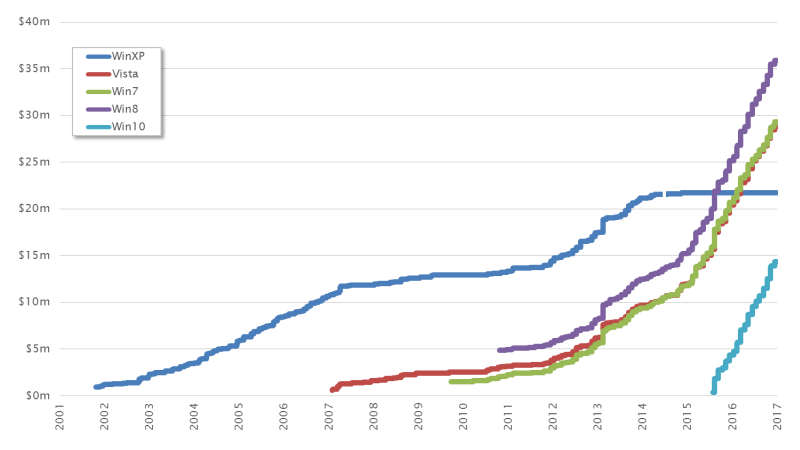
The chart below compares the markets for various Windows versions. A number of noteworthy factors become apparent here.
On the one hand, we see the dark blue curve of Windows XP. This shows how the exploit market for this Windows platform has developed over the last 15 years. Here we can see that the end of life (EOL) arrived for XP in 2014. This dried up the exploit market for this Windows generation.
We can also see that the three curves for Vista, Windows 7 and Windows 8 are very similar in structure, indicating that we are essentially looking at a single Windows generation with only a few points of difference.
And finally, we can see that Windows 10 has a curve all to itself. This follows a similar structure to those currently seen in the predecessor versions.
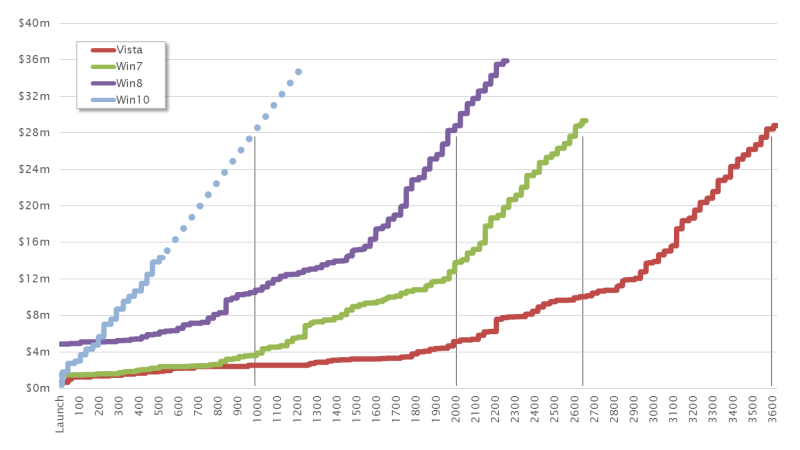
The speed of developments exemplified by the Windows market is most apparent when the curves take the sales launch for each Windows version as their starting point.
Here we can see that Windows Vista reached the USD 28 million mark after almost 3,600 days. Windows 7 managed to reach this point after around 2,500 days and Windows 8 after just 2,000 days. This acceleration is cause for projections that Windows 10, the most recent Windows generation, will take less than 1,000 days to reach the USD 28 million mark.
The pace of growth seems to be reaching its zenith and is thus beginning to slow. For this reason, we currently expect that a future Windows generation will create an exploit market similar to the one currently seen for Windows 10. We are only likely to see a marginal increase in tempo, at least in comparison with developments of previous Windows generations.
Our model for calculating historic, current and future exploit prices helps us to better understand exploit markets and their backgrounds. This makes it possible to compare different products and predict paradigms in software development as well as the future demands of attackers. Overall, a clear growth trend can still be expected in the exploit market. This will continue unabated in coming years. The protection of exposed systems and sensitive data will therefore be of central importance in the future. The issue of vulnerability management retains a central position in the management of secure systems. New vulnerabilities and exploits must be recognized and addressed promptly. This is the only way to minimize the time window for attacks to succeed.
Our experts will get in contact with you!

Marc Ruef

Marc Ruef

Marc Ruef

Marc Ruef
Our experts will get in contact with you!